
Professional investors pay $20,000 or more annually for tools like Bloomberg Terminal. Retail trading apps push "premium" tiers at $30-50 per month. But what if you only need to pick a stock once a month or once every two months?
For periodic investors who take a deliberate, long-term approach, you can access professional-grade screening for about $1 per month—seriously.
Why Expensive Screeners Are Overkill for Most Investors
Premium stock screeners target day traders and active fund managers who execute dozens of trades weekly. They pay for real-time data, advanced charting, and API access they use constantly.
But the evidence shows that most retail investors perform better with fewer trades, not more. A monthly or bi-monthly stock selection approach reduces transaction costs, emotional decisions, and the time commitment that burns out casual investors.
For this approach, you need:
- Reliable fundamental data (valuation, quality metrics, growth rates)
- Basic technical indicators (to time entries reasonably)
- Company filing access (to verify what the numbers mean)
- An educational layer (to keep improving your knowledge)
You don't need real-time quotes, complex derivatives data, or institutional-level analytics.
The $1/Month Stock Selection Strategy
Here's the insight most investors miss: you don't need continuous subscriptions for periodic investing.
Signal Screener costs $1 per week (also available in € and £). But if you're picking stocks monthly:
- Subscribe when you're ready to research
- Use the screener and educational tools for your analysis
- Make your selection
- Cancel until next month
Effective cost: $1 per month for professional-grade screening.
Even if you pick stocks every two months, that's $0.50 per selection. Compare that to $40/month premium apps charging whether you use them or not.
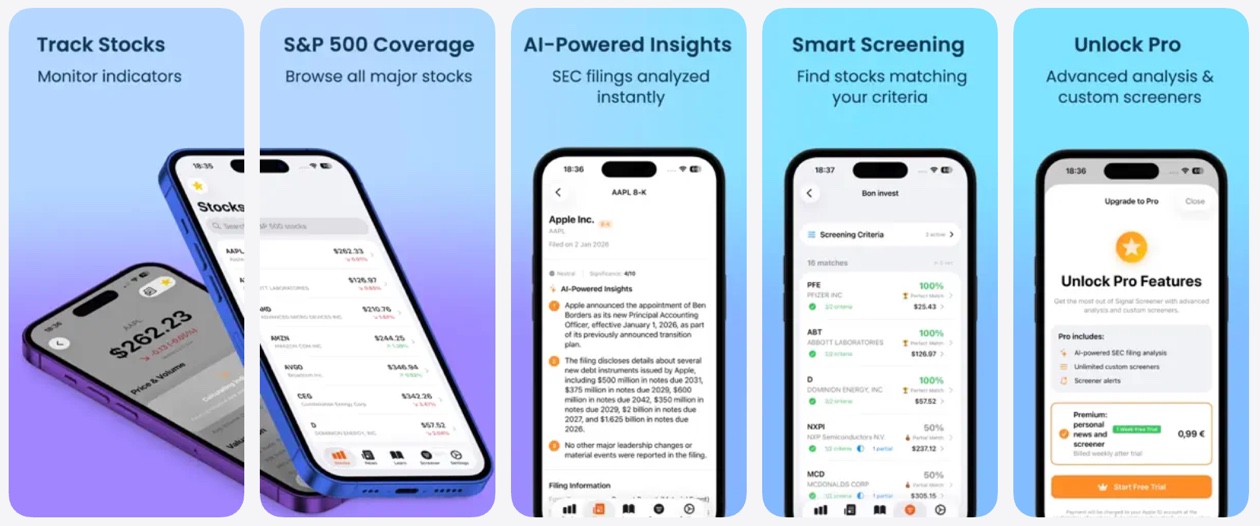
What You Get for $1
Signal Screener includes:
- 8,000 US stocks with comprehensive data coverage
- 30+ fundamental metrics including P/E, P/B, ROE, ROA, debt ratios, margins, growth rates
- Technical indicators like RSI, MACD, moving averages, and beta
- SEC filing browser with real 10-K, 10-Q, and 8-K documents
- 100-day quizzes for progressive learning
- Flash cards explaining what each indicator means
Every ratio explained with examples: Tap any metric to see a full educational breakdown—what it is, a real-world analogy (like comparing P/E ratio to buying a lemonade stand), the exact calculation formula, why it matters for investment decisions, and what values are typically considered good or bad.
Clear green/red color coding: Metrics are visually color-coded so you can instantly see whether a value is favorable (green) or concerning (red). No need to memorize thresholds—the app shows you at a glance which stocks have strong fundamentals and which raise red flags.
Available on iPhone, iPad, and Mac.
The educational features matter. Most premium apps assume you already know what you're doing. Signal Screener teaches you while you use it.
The Monthly Stock Selection Workflow
Week 1: Define Your Investment Thesis
Before opening any app, ask: what am I looking for this month?
- Value investing: Low P/E, low P/B, reasonable debt
- Quality growth: High ROE, consistent revenue growth, expanding margins
- Dividend focus: Strong payout history, sustainable cash flow
- Momentum play: Positive RSI trends, MACD crossovers, above moving averages
Check Reddit communities like r/ValueInvesting or r/stocks for current market sentiment. See what other investors are watching. Note any sectors showing unusual activity.
Your thesis guides your screens.
Week 2: Subscribe and Build Your Screen
This is your $1 week. Subscribe to Signal Screener and build your filters.
Example Value Screen:
- P/E ratio under 15
- Debt-to-equity under 0.6
- ROE above 12%
Example Quality Growth Screen:
- Revenue growth above 10%
- ROE above 20%
- Operating margin above 15%
- EPS growth positive
Run the screen. The color-coded results immediately highlight which candidates have the strongest profiles—look for stocks showing mostly green across your key metrics.
Week 3: Research Your Candidates
This is where cheap apps fail—they show numbers without context.
For your top 3-5 candidates, use Signal Screener's SEC filing browser to read:
- Risk factors section: What could go wrong with this business?
- Management discussion: How do executives view their competitive position?
- Revenue breakdown: Where does money actually come from?
If you're unsure what a metric means while researching, tap it. The app explains every ratio with plain-English examples and shows you how it's calculated.
Cross-reference with Reddit. Search the company ticker in r/stocks or r/investing. See if anyone has done deep analysis. Check for red flags you might have missed.
Week 4: Make Your Selection
After screening and research, pick one stock that best fits your thesis. Or decide that nothing compelling appeared this month—that's valid too.
One thoughtful selection monthly beats thirty impulsive trades.
Cancel your subscription until next month.
Comparing Your Costs
| Approach | Monthly Cost | Annual Cost | Time Investment |
|---|---|---|---|
| Premium screener subscription | $40/month | $480/year | 10+ hours/week |
| Signal Screener (continuous) | $4/month | $48/year | 2-4 hours/month |
| Signal Screener (as-needed) | ~$1/month | ~$12/year | 2-4 hours/month |
| Free tools only | $0 | $0 | 5-8 hours/month |
The free approach works but requires more time piecing together data from multiple sources. The $1 as-needed approach gives you organized data and education for minimal cost.
Sample Monthly Screening Sessions
January: Value Hunting
Screen for: P/E under 12, P/B under 1.5, positive free cash flow
Result: 47 stocks matched. Color coding showed 12 with mostly green metrics. Reviewed top 5 by market cap. Read SEC filings. Checked Reddit for sentiment. Selected one undervalued industrial company.
Total time: 3 hours across the month.
Cost: $1
March: Quality Check
Screen for: ROE above 25%, debt-to-equity under 0.3, revenue growth above 8%
Result: 23 stocks matched. Several tech names, some consumer goods. Tapped unfamiliar metrics to read explanations. Found a Reddit thread with detailed analysis on one candidate. Chose a healthcare company after reading their 10-K expansion plans.
Total time: 4 hours across the month.
Cost: $1
May: Technical Opportunity
Screen for: RSI below 35 (oversold), above 200-day moving average (still in uptrend)
Result: 38 stocks showed short-term weakness in long-term uptrends. Cross-referenced fundamentals—looked for green on quality metrics despite red on momentum. Selected one after confirming quality metrics remained strong.
Total time: 2.5 hours across the month.
Cost: $1
Why Bi-Monthly Works Even Better
Some investors find monthly selection too frequent. Every two months works well because:
- More time for holdings to develop
- Less temptation to overtrade
- Lower emotional involvement
- Even lower effective cost ($0.50 per selection)
The subscription model doesn't penalize you for less frequent use. Subscribe when ready, use what you need, cancel until next time.
Free Complements to Your $1 Screener
Build a complete research stack without increasing costs:
Reddit communities:
- r/investing for general discussion
- r/ValueInvesting for fundamental analysis
- r/stocks for individual stock discussion
- r/SecurityAnalysis for deep dives
SEC EDGAR: Free access to all company filings (Signal Screener makes this easier, but EDGAR is always available)
Company investor relations pages: Earnings calls, presentations, shareholder letters
Financial news: For context on market conditions and sector trends
The $1 screener organizes your process. Free resources supplement your research.
The Educational Advantage
Most premium apps assume expertise. They throw data at you without explanation.
Signal Screener's educational approach includes:
- 100-day quiz program that builds knowledge progressively
- Flash cards for each key metric
- Tap-to-learn on any ratio — see what it measures, a relatable example, the formula, and benchmark values
- Green/red visual system — instantly understand whether metrics are strong or weak without memorizing ranges
You learn while you invest. Every month you understand more than the month before.
This matters because the real cost of bad investing decisions far exceeds any subscription fee. Understanding what you're buying prevents expensive mistakes.
Getting Started This Month
- Define your thesis: What type of stock are you looking for?
- Research Reddit: Check r/investing and r/ValueInvesting for current sentiment
- Subscribe to Signal Screener: $1 for the week
- Build your screen: 3-4 criteria matching your thesis
- Review top candidates: Use color coding to spot strong profiles, tap metrics you don't understand
- Read SEC filings: Verify the story behind the numbers
- Make one selection: Or wait for better opportunities
- Cancel until next month: No ongoing cost
You don't need expensive tools to invest intelligently. You need consistent process, basic data, and the discipline to research before buying.
For $1/month, you get everything required to make informed stock selections on a sustainable timeline.
Frequently Asked Questions
Is end-of-day data sufficient for stock picking?
For long-term investors making monthly or bi-monthly selections, absolutely. Real-time data matters for day traders, but if you're holding stocks for months or years, yesterday's closing price provides adequate information for decisions.
What's the cheapest way to screen stocks effectively?
Signal Screener costs $1/week, but you only need to subscribe when actively researching. For monthly stock picking, subscribe one week per month—making your effective cost about $1/month for access to 8,000 US stocks, 30+ metrics, SEC filings, and educational content.
How do I understand what all the financial ratios mean?
Signal Screener explains every ratio directly in the app. Tap any metric to see a plain-English explanation, a real-world example (like comparing P/E to buying a lemonade stand), the calculation formula, and what values are typically considered good or bad. Green/red color coding also shows at a glance whether values are favorable.
How often should a retail investor pick new stocks?
Evidence suggests less frequent trading generally leads to better returns for retail investors. Monthly or bi-monthly selection works well, allowing time for research without encouraging overtrading.
Can I learn investing while using a screener app?
Signal Screener specifically includes educational features—100-day quizzes, flash cards, tap-to-learn explanations on every metric, and color-coded indicators. This learning-by-doing approach builds practical knowledge faster than passive courses.
What metrics matter most for monthly stock selection?
For most approaches: P/E ratio (valuation), ROE (quality), debt-to-equity (stability), and revenue growth (trajectory). Mastering these four gives you a strong foundation before adding complexity.
Where can I get free investing research and analysis?
Reddit communities like r/investing, r/ValueInvesting, and r/stocks contain extensive free analysis and discussion. SEC EDGAR provides all company filings. Combine these free resources with an affordable screener for a complete research stack.